Hello friends, today I am going to share a book titled “35 Powerful Candlestick Patterns: Trading Related Patterns” in PDF format. This book is essential for individuals interested in trading and the market, as it provides valuable knowledge about these patterns.
With the help of these patterns, you can achieve success in trading and the market. A candlestick pattern is a graphical representation of price movements displayed on a candlestick chart, which some believe can predict specific market movements. Currently, there are 35 patterns available that can significantly contribute to your success in stock market trading.
What are Candlesticks?
Candlesticks are a powerful trading concept and even research has confirmed that some of these patterns have a high predictive value and can produce positive returns. That doesn’t mean that all these tricks always work. Because it completely depends on your technical knowledge.

Simply put, candlesticks provide information about price movements. All candlestick charts are featured in the pdfnotes. This type of chart displays the price on the vertical axis (right side) and the time on the horizontal axis (bottom).
these charts are thought to have been developed in the 18th century by a Japanese rice trader Munehisa Homma.
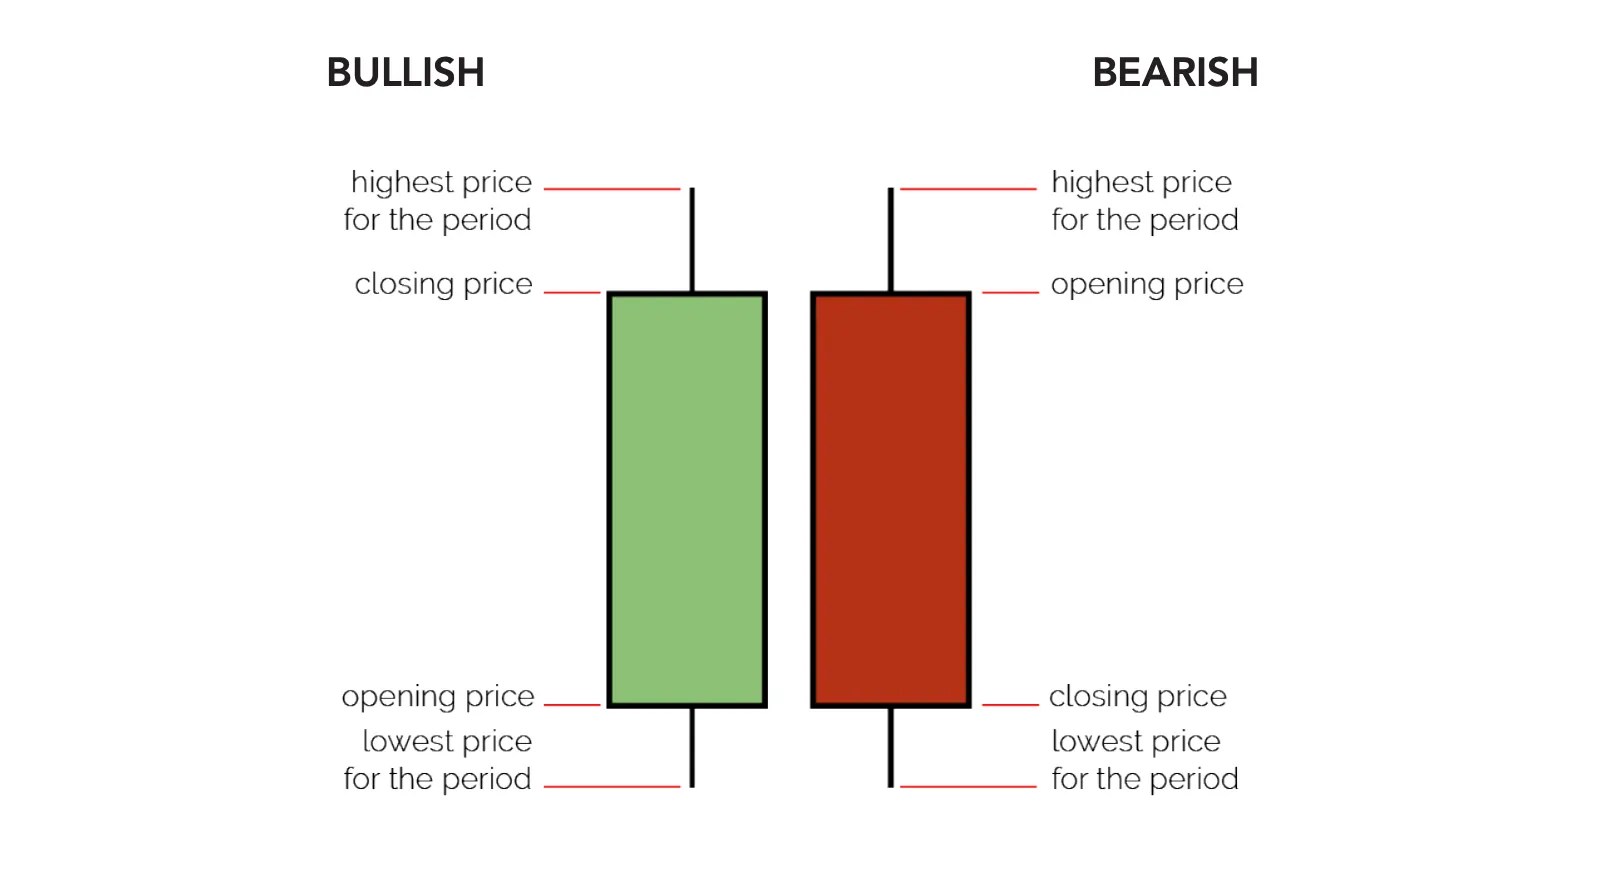
Apart from this, the chart consists of bars with small lines extending from above and below. These bars are known as candles, and each candle conveys four pieces of information.
- The open price
- The close price
- The high price
- The low price
Components of Candlestick
Body – The thickest part of the candlestick represents the difference between the opening and closing prices.
Wick – The upper and lower lines of the candlestick body depict the price range or highs and lows during a specific time frame.
Color – The color of the candlestick helps identify whether it is bullish or bearish, indicating the overall market sentiment. This information can assist in making decisions about buying or selling shares.
Candles
Candles display information for a specific unit of time, and the symbol chart represents a particular day. Therefore, each candle represents the open, close, high, and low prices for that specific day.
Through the below pattern, you can understand how those four pieces of information the open, low, high, and close for a given period of time are visualized in the context of a candle.

Bullish Candlestick Patterns
Bullish Hammer
- The hammer candlestick pattern consists of a short body, a long wick protruding below the body, and little to no wick above. It resembles the shape of a hammer.
- This type of pattern should occur in the downtrend of the stock, meaning that the price of the stock is declining.
Bullish single candle reversal pattern that forms a downtrend

Inverted Hammer

Bullish Engulfing

Bearish Candlestick Patterns
Evening Star
A bearish three-candle reversal pattern that forms in an up trend

Shooting Star
Bearish single candle reversal pattern that forms in an up trend.

Hanging Man
The Hanging Man candlestick pattern resembles a hammer but appears in an uptrend. Its downward wick indicates bearish pressure.
Bearish single candle reversal pattern that forms in an up trend.
